Understanding Your Wellness Metrics
What your HeraVita 3D body scan reveals and why it matters for women at every life stage
When you step into a HeraVita 3D body scanner, over 250 precise measurements are captured from the surface geometry of your body - your circumferences, proportions, posture and bilateral symmetry - and transformed into a personalised set of wellness metrics that no bathroom scale, tape measure or standard health check could ever provide.
This article explains what each wellness metric means, how it is calculated, why it was chosen, and what it can tell you about your health - in plain language, grounded in published research, and written specifically for Australian women aged 35 and over.
Your wellness profile
Once your scan is complete, your personalised wellness profile appears in your HeraVita Shopify account alongside a 3D avatar generated from your scan. The avatar shows the geometry of your body as the scanner captured it - front and back - and is the starting point for everything that follows.

The profile is organised into clear sections — cardiometabolic risk, body shape and fat distribution, body proportion patterns, body composition, muscle health, posture and structural indicators, bilateral screening, bone health, and research tier metrics — each with your measured value, an age-adjusted reference range, and a plain-language interpretation.
Tap the ⓘ icon beside any metric name for a plain-language explanation of what that metric means and why it matters. Everything is designed to be readable without a science background.
How your metrics are calculated
HeraVita uses non-contact 3D optical body scanning technology to capture the surface geometry of your body. From this, your height, weight and over 250 circumference, length and posture measurements are derived. These raw measurements are then used to calculate your wellness metrics using validated, peer-reviewed scientific formulas.
The formulas used — including those for body fat percentage, lean body mass, basal metabolic rate, body water, and body shape indices — are drawn from published research and are the same methods used by clinical researchers, sports scientists and body composition specialists worldwide. Where multiple formulas exist for the same metric, we have chosen the one with the strongest validation for women in the Australian population, and the one most appropriate for women at midlife and beyond.
Bilateral symmetry — left vs right
Shoulder drop and height difference
Inseam and leg length
Body surface geometry and volume
Lean body mass and body water
Body shape and roundness indices
Metabolic rate estimates
Bilateral asymmetry flags
Section 1 — Cardiometabolic risk indicators
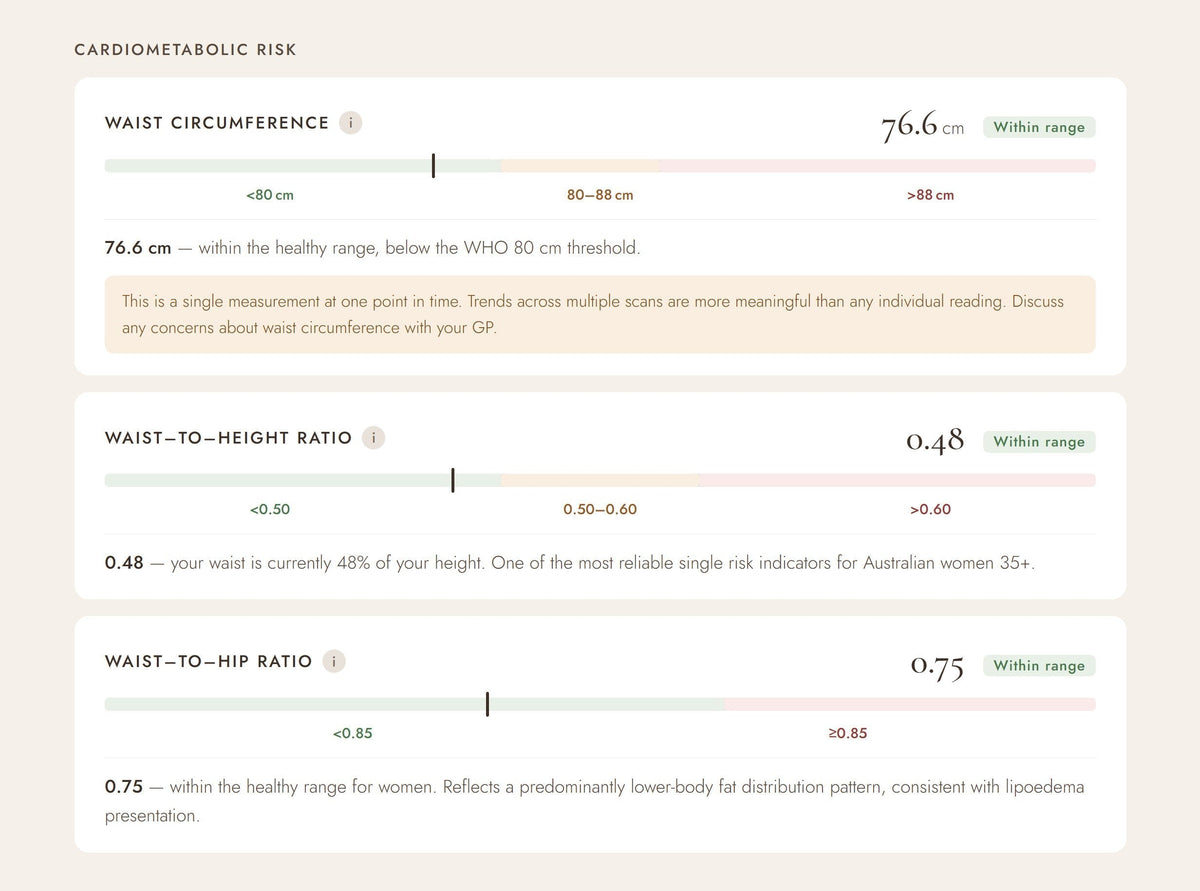
These metrics reflect how your body's shape and proportions relate to the risk of heart disease, type 2 diabetes, and other metabolic conditions. They are among the most clinically meaningful measurements HeraVita provides, and are the primary reason waist measurement matters far more than weight alone.


Section 2 — Body shape and fat distribution
Beyond simple ratios, HeraVita calculates three validated body shape indices that capture abdominal fat distribution with greater precision. These are particularly valuable for women with a healthy BMI who may still carry disproportionate fat around the middle - a pattern that BMI alone consistently misses. This section also includes body shape and character measurements that are directly relevant to garment fit.

Section 3 — Body proportion patterns and lipoedema awareness
This section is unique to HeraVita. No other consumer body scanning service currently surfaces lipoedema-relevant measurements in a structured, accessible way.
Lipoedema is a chronic condition affecting almost exclusively women. It is characterised by a symmetrical accumulation of fat tissue in the legs and often the arms, typically disproportionate to the waist and upper body. It is hormonally sensitive - commonly becoming more pronounced at puberty, pregnancy and perimenopause. It does not respond to diet or exercise. And it is, despite affecting an estimated 1 in 10 women, chronically underdiagnosed - with an average delay to diagnosis of over a decade.
The reasons for this diagnostic gap are well documented: lipoedema fat is frequently mistaken for general weight gain. Women are told to eat less and move more. The condition is dismissed. And because the lower body and arm fullness is bilateral - affecting both sides equally - it does not present as the dramatic one-sided swelling most people associate with lymphoedema.
HeraVita's 3D scan captures bilateral measurements of both thighs, both calves, both upper arms, and both forearms, alongside waist-to-thigh and waist-to-calf ratios. Together, these measurements can objectively document the disproportionate lower-body and arm fullness that characterises lipoedema.

If your measurements show a pattern consistent with lipoedema, HeraVita will note this in your profile with clear, plain-language information about what lipoedema is, how it differs from general weight gain and lymphoedema, and how to raise it with your GP. This observation is from surface geometry measurements only — it is not a clinical examination, not a diagnosis, and not a staging of any condition. Only a clinician who examines you can diagnose lipoedema.
Section 4 — Body composition
Body composition metrics move beyond weight to describe what your body is actually made of - how much is fat tissue, how much is muscle and organ mass, and how well hydrated you are. For women at midlife, these metrics are often more clinically meaningful than body weight or BMI.

Section 5 — Muscle and sarcopenia screening
Sarcopenia is the gradual loss of muscle mass and strength that comes with age. It begins in the mid-30s and accelerates significantly after menopause. It is associated with reduced mobility, increased fall risk, poorer metabolic health, and reduced quality of life. Despite this, it is rarely screened for in routine health checks.
HeraVita includes three measurements used in muscle-health screening, each with a published threshold drawn from the sarcopenia and anthropometry literature.

Section 6 — Posture and structural indicators
The 3D scanner captures posture data that no other consumer health tool currently provides. These measurements are unique to optical 3D body scanning and offer a window into structural patterns that may be relevant to musculoskeletal health, bone health and long-term mobility.

Section 7 — Bilateral screening: lymphoedema and lipo-lymphoedema
1 in 7 Australian women will be diagnosed with breast cancer in their lifetime. Of those who undergo lymph node removal or radiotherapy as part of treatment, an estimated 20–30% will develop lymphoedema - a chronic condition caused by damage to the lymphatic system, resulting in persistent swelling, most commonly in the arm.
Lymphoedema is not curable, but it is very manageable when caught early. And early detection depends on having an accurate baseline measurement - a record of how your arms compared before any swelling occurred.
HeraVita records the circumference of both arms at multiple points - upper arm and forearm - as well as both thighs. This baseline is established at your first scan and stored as a personal reference point. At every subsequent scan, any change from this baseline is tracked and flagged. A difference of 2 cm or more between arms at any single measurement point is the standard clinical referral threshold.

These measurements establish your personal baseline. They are surface circumference measurements only - they cannot assess tissue fluid content, lymphatic function, or other clinical signs. Do not interpret these results as a lymphoedema assessment. If you have concerns about arm or leg swelling following cancer treatment or surgery, contact your GP, breast care nurse, or a qualified occupational therapist with lymphoedema training.
For women with lipoedema, this bilateral monitoring takes on additional significance. Lipo-lymphoedema — a condition where lymphoedema develops on top of existing lipoedema — is a recognised progression in some women. The bilateral measurements in your HeraVita profile provide the earliest possible detection framework for this progression.
Section 8 — Bone health
Bone health is among the most clinically urgent concerns for women in perimenopause and beyond. The oestrogen decline that accompanies the menopause transition accelerates bone mineral density loss - a process that begins gradually in the mid-30s but can accelerate sharply in the years surrounding menopause. Yet bone density loss is largely silent until a fracture occurs, and is rarely assessed in routine health checks before a significant event prompts it.
HeraVita's bone health section provides a population-level estimate of bone mineral content alongside contextual guidance - not to replace clinical assessment, but to surface the conversation when it is most worth having.

Section 9 — Research tier metrics
These metrics are derived estimates - not directly measured - and have not been individually validated for this population. They are provided for women who want a deeper layer of body composition insight, and should be read alongside your primary metrics, not in place of them.
Beyond the primary wellness profile, HeraVita surfaces a set of advanced body composition estimates derived from your scan data. These are calculated using multi-compartment modelling - a method that partitions your total body mass into distinct biological components. The formulas are established in body composition research; however, because they are derived rather than directly measured, the estimates carry greater uncertainty than your primary metrics.
They are presented with full transparency about their basis, and are most useful as a longitudinal signal - tracking relative change across scans - rather than as precise absolute values.

Important information about your results

Every wellness profile opens with a plain-language summary of what these results are — and what they are not. The six points shown above apply to everything in your profile:
- These results are for wellness awareness only. They do not constitute a medical diagnosis, a clinical assessment, or a referral, and do not replace advice from your GP, specialist, occupational therapist, or any other qualified healthcare professional.
- Your wellness metrics are calculated from 3D surface geometry measurements captured in a 5-second scan. They are not produced by bioimpedance technology, DEXA scanning, or clinical examination. Results from different measurement methods will differ and should not be directly compared.
- A pattern in your results that appears consistent with a health condition is not a diagnosis. Only a clinician who examines you - taking a full history, performing a physical examination, and applying clinical judgement - can diagnose any condition.
- Do not make any treatment decision - including starting, stopping, or adjusting treatment, medication, or any other intervention - based on these results alone. Always discuss changes with your GP or treating clinician first.
- If any result surprises you or appears to conflict with what a clinician has told you, the clinician's assessment takes precedence. Raise it with them directly.
- Reference ranges shown are age-adjusted population averages. They are a guide, not a personal target. Your individual health history, life stage, and circumstances always matter more than a population threshold.
Tracking your progress: subsequent scan comparisons
Your first scan establishes your personal baseline - a precise record of where your body is today. Every scan after that tells you something more important: the direction of change. HeraVita's wellness dashboard is designed to make that comparison clear at a glance.
When you log into your HeraVita Shopify profile after a subsequent scan, you will see your dashboard view — a summary of all metric categories showing at a glance whether each area is stable, improving, or worth monitoring. Tap any category to expand the detailed comparison.
The dashboard shows:
- Summary tiles for each metric category - colour-coded to show stable, monitoring, or attention needed at a glance
- Automatic alert banners when a value approaches or crosses a clinically meaningful threshold
- A detailed table for each section showing your baseline value, current value, and the change — colour-coded green for improvement, amber for monitoring, grey for stable
- Trend charts for the most important metrics — lean body mass, calf circumference, and forearm asymmetry — showing the trajectory across all scans on file
- Scan selector at the top to switch between any two scans and compare them directly
We recommend scanning every three to six months to build a meaningful picture of change over time. The more scans on file, the more informative your trend data becomes and the earlier any meaningful change can be identified.
Why these metrics matter especially at midlife
All of HeraVita's wellness metrics are relevant across adult life. But they take on particular importance for women in their late 30s, 40s, 50s and beyond - because this is the life stage when the body changes most significantly, most rapidly, and with the least clinical attention.
Perimenopause and menopause bring a cluster of changes that directly affect body composition:
- Fat gain accelerates, particularly around the abdomen - the rate of central fat gain roughly doubles during the menopause transition
- Lean body mass declines - muscle loss accelerates after menopause without active resistance training
- Bone density decreases - the Melbourne Women's Midlife Health Project confirmed accelerating bone mineral density loss during the late menopause transition
- Fat distribution shifts from peripheral (hips and thighs) to central (abdomen) - a pattern associated with higher cardiometabolic risk
- Lipoedema, if present, commonly worsens - hormonal changes that drive fat redistribution also accelerate lipoedema progression
Standard health checks - weight, BMI, blood pressure - capture almost none of this. HeraVita's wellness metrics are designed precisely to fill this gap: to give women the body insight they need to make informed decisions about their health, advocate for themselves in clinical settings, and track what matters over time.
How to read your results
A few important principles for interpreting your wellness metrics:
- These results are for wellness awareness and body insight. They are not medical diagnoses and do not replace advice from your GP or healthcare professional.
- Reference ranges are age-adjusted - your profile applies the appropriate thresholds for your age group, not generic population averages.
- Trends over time are more meaningful than any single reading. Your first scan establishes your baseline; subsequent scans reveal whether metrics are stable, improving or changing.
- Some metrics are less reliable in the presence of lipoedema — including body fat percentage, BMI, and circumference-based muscle screening metrics. Your profile notes this where relevant.
- If any metric prompts concern, the appropriate response is a conversation with your GP or relevant specialist — not self-diagnosis. Your profile provides plain-language guidance on when and how to seek that conversation.
A final word
HeraVita was built for women who have been underserved by conventional health metrics. For women whose BMI said they were fine when their waist circumference told a different story. For women whose body fat was dismissed because their weight was normal. For women with lipoedema who were told for years that the answer was diet and exercise. For women who had breast cancer and have no baseline record of what their arm measured before treatment.
Your wellness metrics are an act of attention paid to your body - precise, personalised, and grounded in science. They are calculated fresh from your scan, displayed only for you, and built to give you something rare in women's health: objective information about what is actually happening in your body, in language you can understand and act on.
We recommend scanning every three to six months to build a meaningful picture of change over time. Your body has a story to tell. HeraVita helps you read it.
Body scan measurements are stored in de-identified form for aggregate research purposes only. Individual wellness metrics are not accessible retrospectively by HeraVita staff and are not shared with any third party. Profile illustrations shown in this article are design examples only. Values shown are for demonstration and do not represent any individual's results.
heravita.com.au

Leave a comment
Add a comment